COVID TRACKER 19
![]()


Description
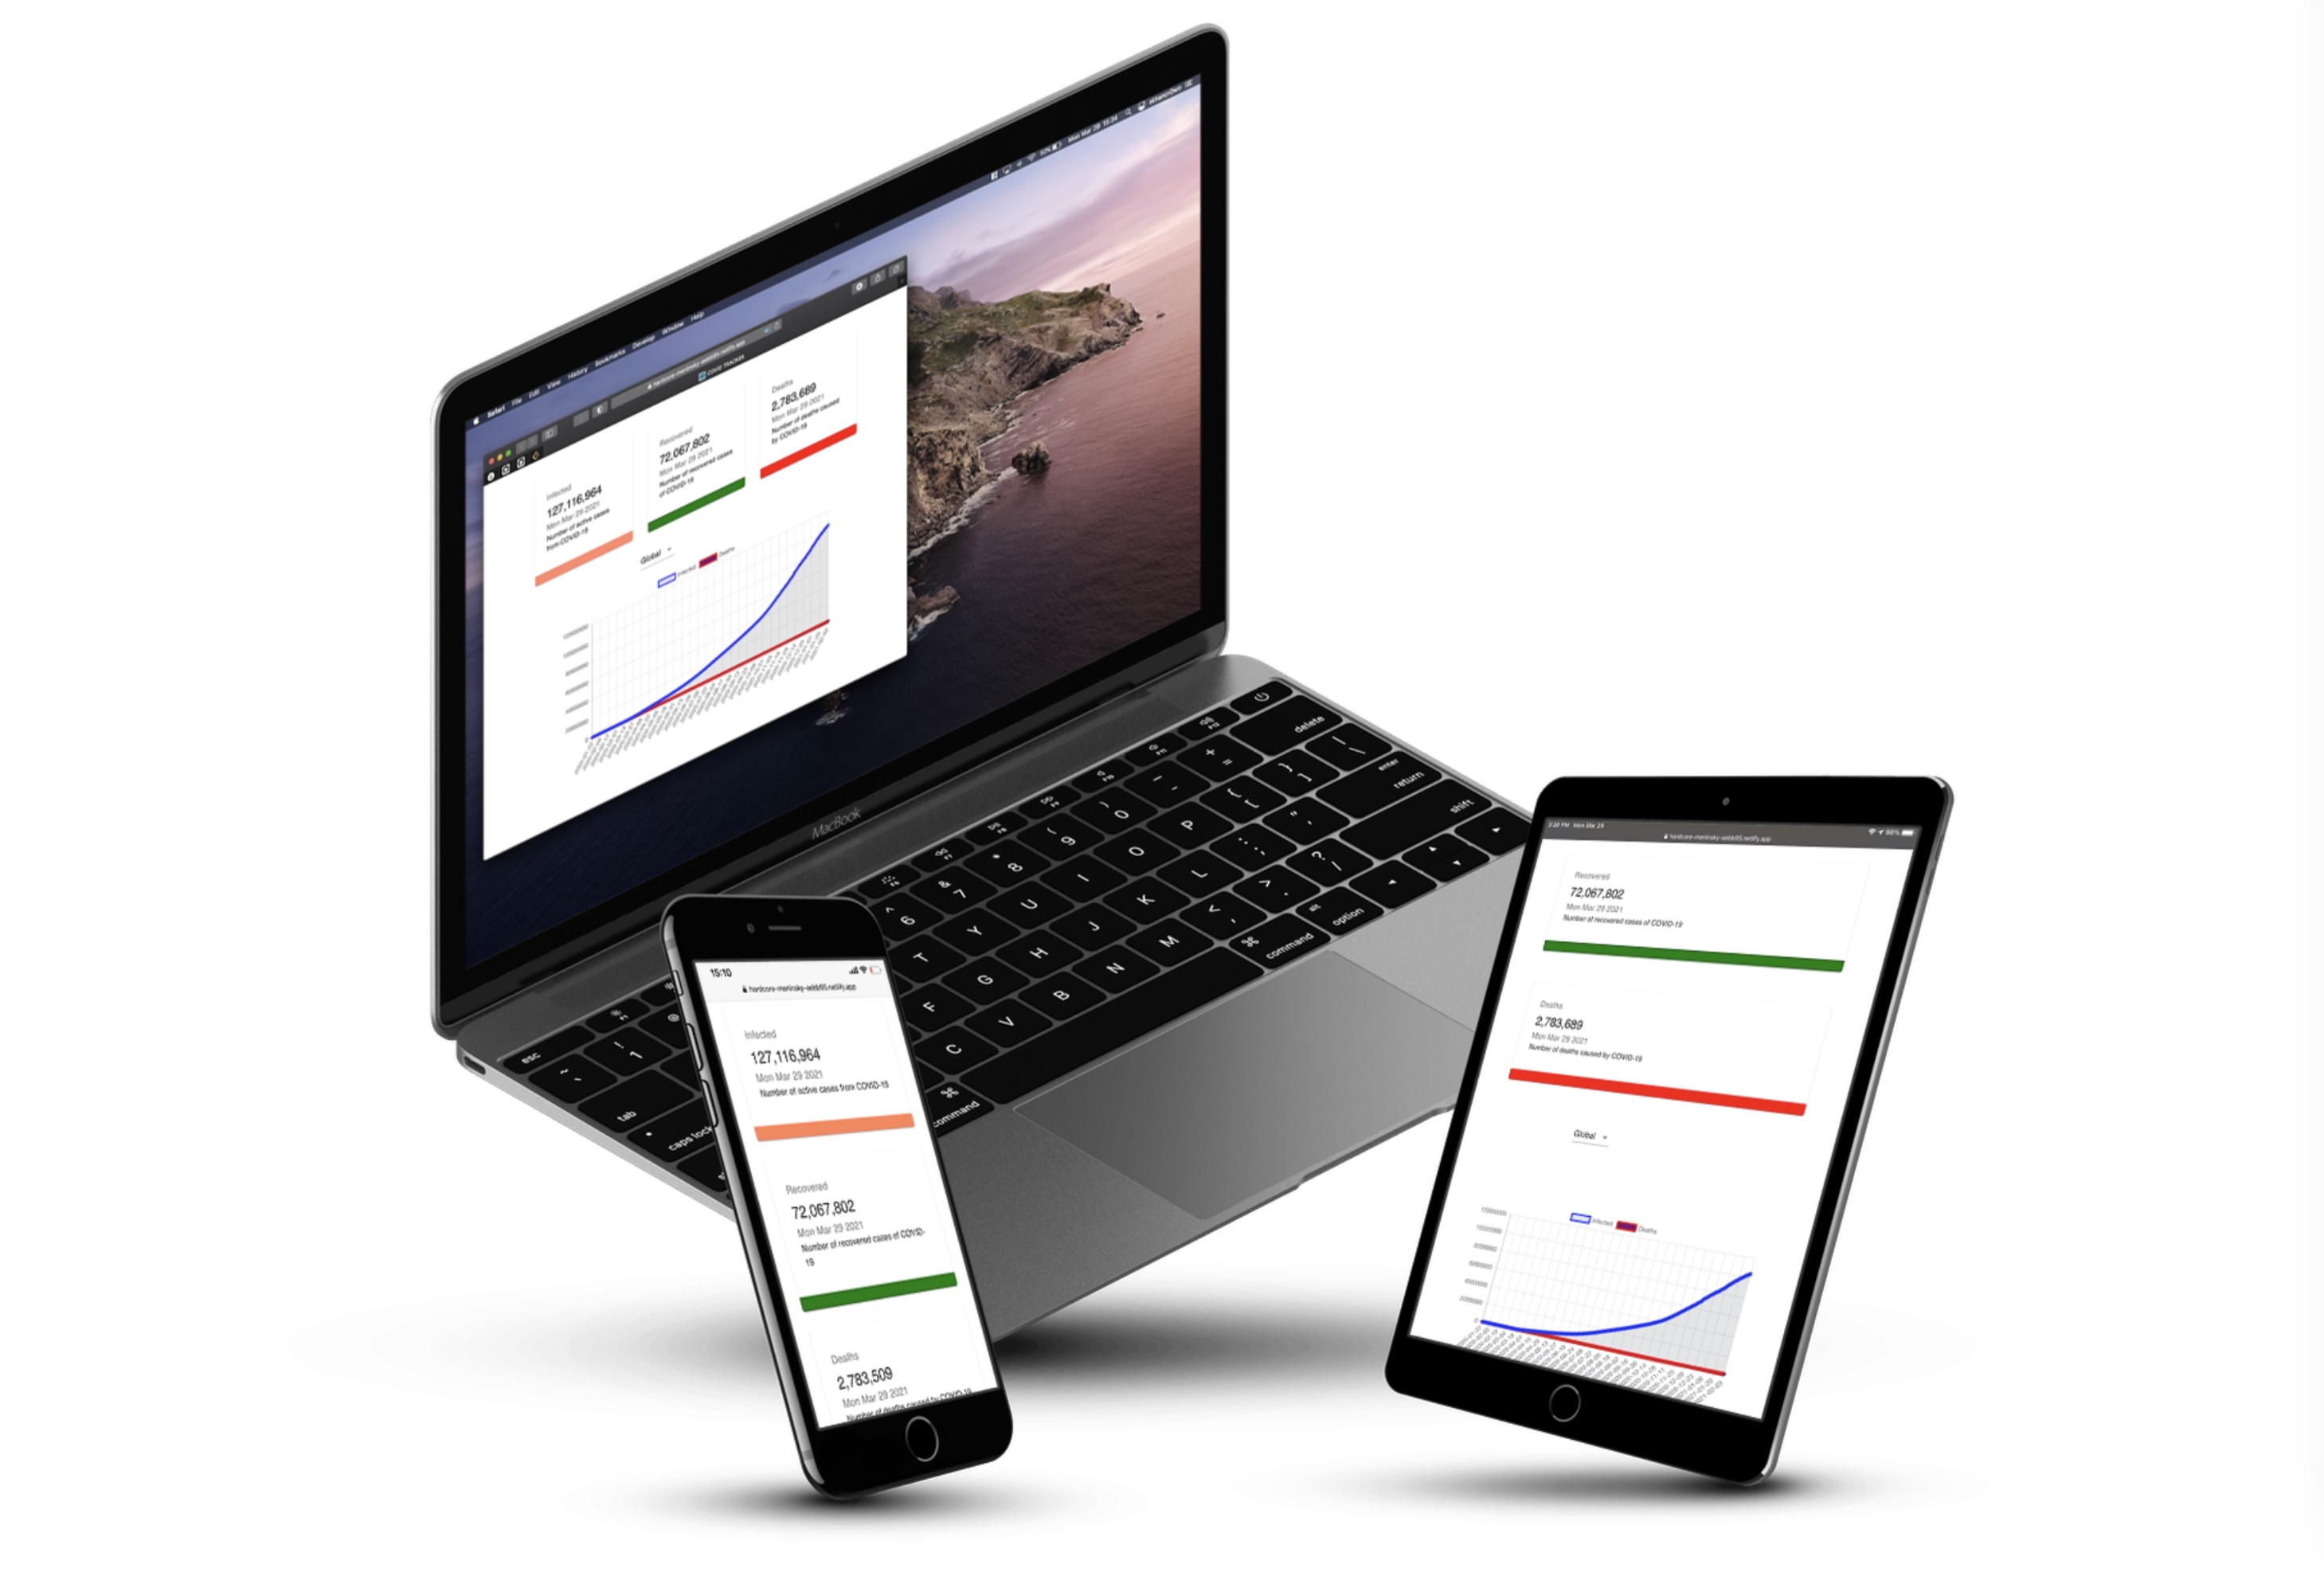
A web app that provides detailed information on local and global coronavirus, covid-19, cases with active, recoveries, and death rate for each country and the global total.
The Covid Tracker-19 collects and publishes the most complete data avialable. Covid tracker-19 charts, infected, recovered, and deaths are based on data collected by the John Hopkins University.
- Data visualization depicts information in a graphical form in both line charts and bars.
- Selection of countries from a drop down menu select from global or individual countries. Providing detail information on infections, recoveries, and death totals.
Responsive design The design and development of the web app response to the user's platform, screen size, and device orientation.

Web App
The web app was deployed in Netlify and is avialable for use. The data that is used by the charts in the web app is being provided by the John Hopkins University CSSE as a JSON API
Site
Types of charts
Mobile support
The web app is responsive and designed and developed with a mobile first approach.
Built with
![]()
- React.js - A JavaScript library for building user interfaces. Declarative with views and state management. Component-based Build encapsulated components that manage their own state, then compose them to make complex UIs.
- Matarial-UI - the data you want to communicate, and what you want to convey about that data.
Roadmap
Support for app will continue with future implemations.
Author
Minierparedes